Building a realtime network traffic LED indicator

Photo by Alex King on Unsplash
LED traffic indicators are common on most networking devices, from home routers, to commercial equipment and Ethernet-equipped Raspberry Pis.
The Ethernet standards (IEEE 802.3 and related) don’t define a standard for activity lights. Therefore, the blinking patterns observed on these devices are completely up to the manufacturer. Most hardware LEDs briefly flash each time a packet is sent or received, with a steady green (or amber, blue, etc.) light indicating that a connection is established with no active transfer happening at the moment.
As visual cues, they’re useful indicators of a network’s normal function without requiring software or other tools.
Transforming static software LEDs
RaspAP uses software LEDs to indicate the operational status of many services, system resources and interfaces. Like hardware LEDs, they’re visual indicators designed to provide a quick, at-a-glance status of some part of the system.
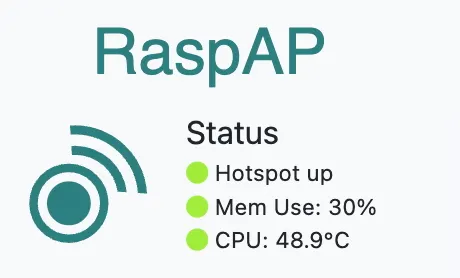
These software LEDs, while functional, are mostly static. That is, they display a fixed green, amber or red color to indicate the status of some aspect of the system. What if, like the hardware LEDs, they could be transformed to indicate network traffic over a given interface?
Design goals
Manufacturers implement hardware LEDs by connecting them to the router’s processor, which monitors network traffic and triggers the appropriate light patterns based on data flow through the device’s ports.
Network-like blinking needs responsiveness. Hardware routers often blink their LEDs at very high frequencies. This is possible due in large part to these devices being built with application-specific integrated circuits (ASICs) customized for tasks such as these, in addition to routing packets and performing all the other functions of a typical router.
By contrast, the Raspberry Pi family of devices use general-purpose ARM processors. This gives them much greater versatility, allowing the same hardware to serve many different purposes based solely on the software it runs. The tradeoff, of course, is performance when compared with an ASIC-based device.
A central goal for this implementation, therefore, is to strike a balance between real-time feedback and resource efficiency. The components that could be used to build a dynamic software LED should be as lightweight as possible, and not hinder the normal operation of RaspAP, the browser, or the host device itself.
Putting it all together
With these goals in mind, I’ve settled on a technique for monitoring network traffic that’s equal parts lean and extremely fast. A tradeoff is made here between responsiveness and resource use. The software LED won’t update as quickly as its hardware counterpart, but it’s still fast enough to provide useful visual feedback to an end user.
By necessity, the monitor will run as a background process that’s daemonized to perform a task at a specific interval. It should also execute at system boot and be controllable via a systemd unit file. This will satisfy the backend or server portion.
On the front-end, the web application will be modified to poll values supplied by the daemon and update the LEDs in the UI accordingly. Heavy DOM manipulations are strictly avoided and a reasonable interval value will be used to transform the static LEDs into dynamic ones.
Step 1: Monitor network activity
Linux gives us several ways to achieve this. Either cat /proc/net/dev or ifconfig wlan0 could be used to get TX/RX byte counters for a given network interface. With the former, capturing byte counters for wlan0 is done like so:
/proc/net/dev is extremely low-cost — it's just a file read. It can be safely polled 10–20 times per second (every 50–100 ms) with minimal system impact, especially on a Raspberry Pi. This is comparable to how top, htop, or system monitors work.
Step 2: Poll and calculate activity
A small program is required to read the current TX/RX bytes from /proc/net/dev at a fixed interval (let’s say every 100ms), read the next value and calculate the difference. This is a persistent process written in compiled C that runs in the background. In the next step, I’ll create a systemd unit file that uses this program as the basis for a service.
The contents of this source file, which I’ve named raspap-network-monitor.c, is shown below:
1 2 3 4 5 6 7 8 9 10 11 12 13 14 15 16 17 18 19 20 21 22 23 24 25 26 27 28 29 30 31 32 33 34 35 36 37 38 39 40 41 42 43 44 45 46 47 48 49 50 51 52 53 54 55 56 57 58 59 60 61 62 63 64 65 66 67 68 69 70 71 72 73 74 75 76 77 78 79 80 81 82 83 84 85 86 87 88 89 90 91 92 93 94 95 96 97 98 99 100 101 102 103 | |
There are a couple of things worth noting here. First, the monitored interface is set by passing a value for the first argument (*iface = argv[1]). The interface value is then used in read_interface_bytes() to fetch the current TX/RX byte values. From there, it’s a simple matter of calculating the difference from the previous ones.
The second item of interest is the location this value is written to, and how it’s done. /dev/shm/ is a temporary file storage (tmpfs) that resides in RAM. In this context, “shm” is a reference to shared memory. You can see it on your system with mount or df, like so:
/dev/shm/ is often used for temporary high-speed files (e.g., logs, metrics), RAM-based caching and named memory blocks for C/C++ or other low-level programs. Read/write operations are extremely fast with almost no I/O latency, making it ideal for this application. The contents of tmpfs are lost on reboots, but this isn’t a concern.
Finally, in Bash one could simply use echo "$total_diff" > "$TMPFILE" to write out to tmpfs. However, due to timing issues, the file can be read mid-write (i.e., during echo in the shell script). On the front-end, this will often return an error such as ERR_CONTENT_LENGTH_MISMATCH 200 (OK). Even if the response returns 200 OK, the browser will throw an error because the response body didn’t match the declared length.
The solution is to instead write automically with a temp file and use mv. This is done in Bash like so:
tmpfile=$(mktemp /dev/shm/net_activity.XXXXXX)
echo "$total_diff" > "$tmpfile"
chmod 644 "$tmpfile"
mv "$tmpfile" "$TMPFILE"
mv operation updates directory entries (inodes) which is a single, quick operation at the filesystem level. Atomicity refers to its all-or-nothing execution; there’s no intermediate state where the operation is partially complete. This ensures that the file is never in a partially written state.
Step 3: Create a systemd service
In this step, a systemd unit file is created to autostart the script on boot. I’ve given it the descriptive name raspap-network-activity.service. The contents are below:
# Author: BillZ <billzimmerman@gmail.com>

[Unit]
Description=RaspAP Network Activity Monitor
After=network.target

[Service]
ExecStart=/bin/bash /etc/raspap/hostapd/network-activity.sh
Restart=always
RestartSec=2
User=root

[Install]
WantedBy=multi-user.target
After=network.target waits for networking to initialize. The script could reside in a location such as /usr/local/bin/, however by convention RaspAP consolidates other service files and scripts under /etc/raspap/.
With this done, the unit file is copied to its destination with sudo cp raspap-network-activity.service /etc/systemd/system/. Thereafter, enabling and starting the service is done with the following:
$ sudo systemctl daemon-reload      # load new unit files
$ sudo systemctl enable raspap-network-activity.service
$ sudo systemctl start raspap-network-activity.service
$ sudo systemctl status raspap-network-activity.service
● raspap-network-activity.service - RaspAP Network Activity Monitor
     Loaded: loaded (/etc/systemd/system/raspap-network-activity.service; enabled; preset: enabled)
     Active: active (running) since Sat 2025-04-19 23:04:20 PDT; 2s ago
   Main PID: 96370 (bash)
      Tasks: 2 (limit: 768)
        CPU: 583ms
     CGroup: /system.slice/raspap-network-activity.service
             ├─96370 /bin/bash /etc/raspap/hostapd/network-activity.sh
             └─96468 sleep 0.1
Step 4: Make it accessible to RaspAP
Web services like lighttpd and nginx cannot access files outside their web root due to the security principle of least privilege. That is, these services typically run as a non-privileged user (for example, ‘www-data’) with limited permissions. For security reasons, this user only has read access to the web root directory and its subdirectories.
This means that attempts to access files like /dev/shm/net_activity will result in a permissions error. There’s an easy fix for this, though. The file may be symlinked to a web-accessible path, like so:
With this done, JavaScript, PHP or indeed any language enabled by the web server can access this file from within the web root.
Step 5: More polling (JavaScript)
Moving to the front-end, a JavaScript handler uses fetch() to get the latest value from the /app/net_activity file created in the previous step:
function updateActivityLED() {
  const threshold_bytes = 300;
  fetch('/app/net_activity')
    .then(res => res.text())
    .then(data => {
      const activity = parseInt(data.trim());
      const leds = document.querySelectorAll('.hostapd-led');

      if (!isNaN(activity)) {
        leds.forEach(led => {
          if (activity > threshold_bytes) {
            led.classList.add('led-pulse');
            setTimeout(() => {
              led.classList.remove('led-pulse');
            }, 50);
          } else {
            led.classList.remove('led-pulse');
          }
        });
      }
    })
    .catch(() => { /* ignore fetch errors */ });
}
setInterval(updateActivityLED, 100);
threshold_bytes set to 300. What’s special about this value? The network-activity.sh script calculates a composite value based on the observed difference of TX and RX bytes on the interface being monitored.
Even on an idle network, small amounts of background multicast or broadcast traffic is often present. This can include things like ARP table maintenance or service advertisement (UPnP, Bonjour, mDNS, ZeroConf, and so on). Blinking an LED for every piece of observed network traffic is excessive and not particularly useful.
In testing, a value of 300 bytes seemed to strike a balance and filter low-level network traffic from, say, something a user of RaspAP might generate while connected to the interface.
When activity exceeds this threshold value, a class toggle is applied. The setInterval(updateActivityLED, 100) updates at 10 times per second. This isn’t excessive because, 1) the fetch is for a very small file in memory, and 2) the script does minimal parsing and DOM manipulation.
Step 6: Add a dash of CSS
Next, we’ll need new led-pulse and hostapd-led classes to support the JavaScript handler:
.led-pulse {
  opacity: 0.3 !important;
}

.hostapd-led {
  color: #28a745;
  opacity: 1;
  transition: opacity 0.05s;
}
Step 7: Enable the LEDs in markup
The hostpad-led class is then simply added to the markup wherever a network activity LED is needed, like so:
<span class="icon"><i class="fas fa-circle hostapd-led service-status-<?php echo $state ?>"></i></span>
The results
With the implementation done, all that’s needed now is some network traffic. For testing, a client device is connected to the access point created by RaspAP. Thereafter, some moderate browsing is performed on the client and the results are observed in RaspAP’s web UI.
A dynamic network traffic LED showing activity on wlan0.
My overall impression of the new, dynamic network traffic LED is that it closely resembles its hardware counterpart. A 100ms interval (10 Hz) is actually on the low end of what’s considered “visibly responsive.” Despite this, I find it to be a surprisingly accurate and useful indicator.
Update: if you’d like to implement this in your own project, the source code is available here.
Discussions
Questions or comments about this implementation? How would you improve on it? Join the discussion here.